Diabetes management: helping patients adopt positive behaviors

Challenge

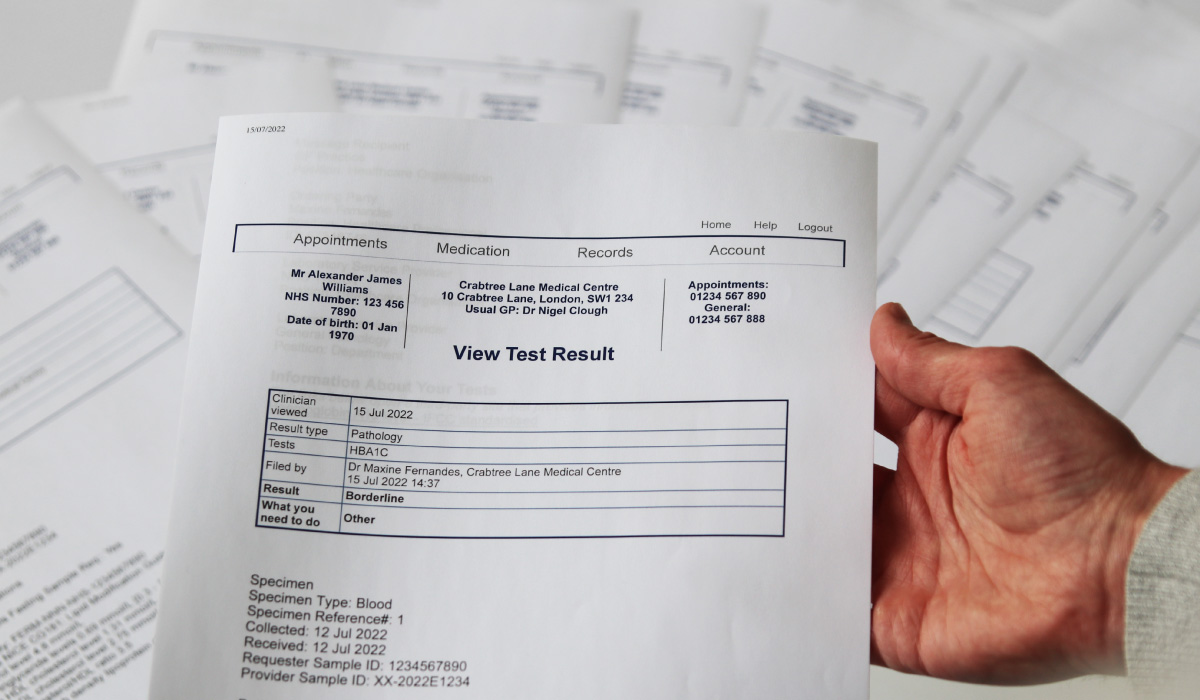
We wanted to improve the self-management of Type 1 diabetes (T1D) by creating more accessible test results data, to educate and motivate patients with Type 1 to adopt positive behaviors and better manage their condition.

Approach

We assessed the current data solutions and digital applications offered to T1D patients to identify key challenges and opportunities. We looked for inspiration outside the medical sector, assessing the use of both digital and printed media. Our UX/UI designers and information designers worked together to explore how print and digital media could be used in combination to improve periodic (6 months) presentation of diabetes test results.
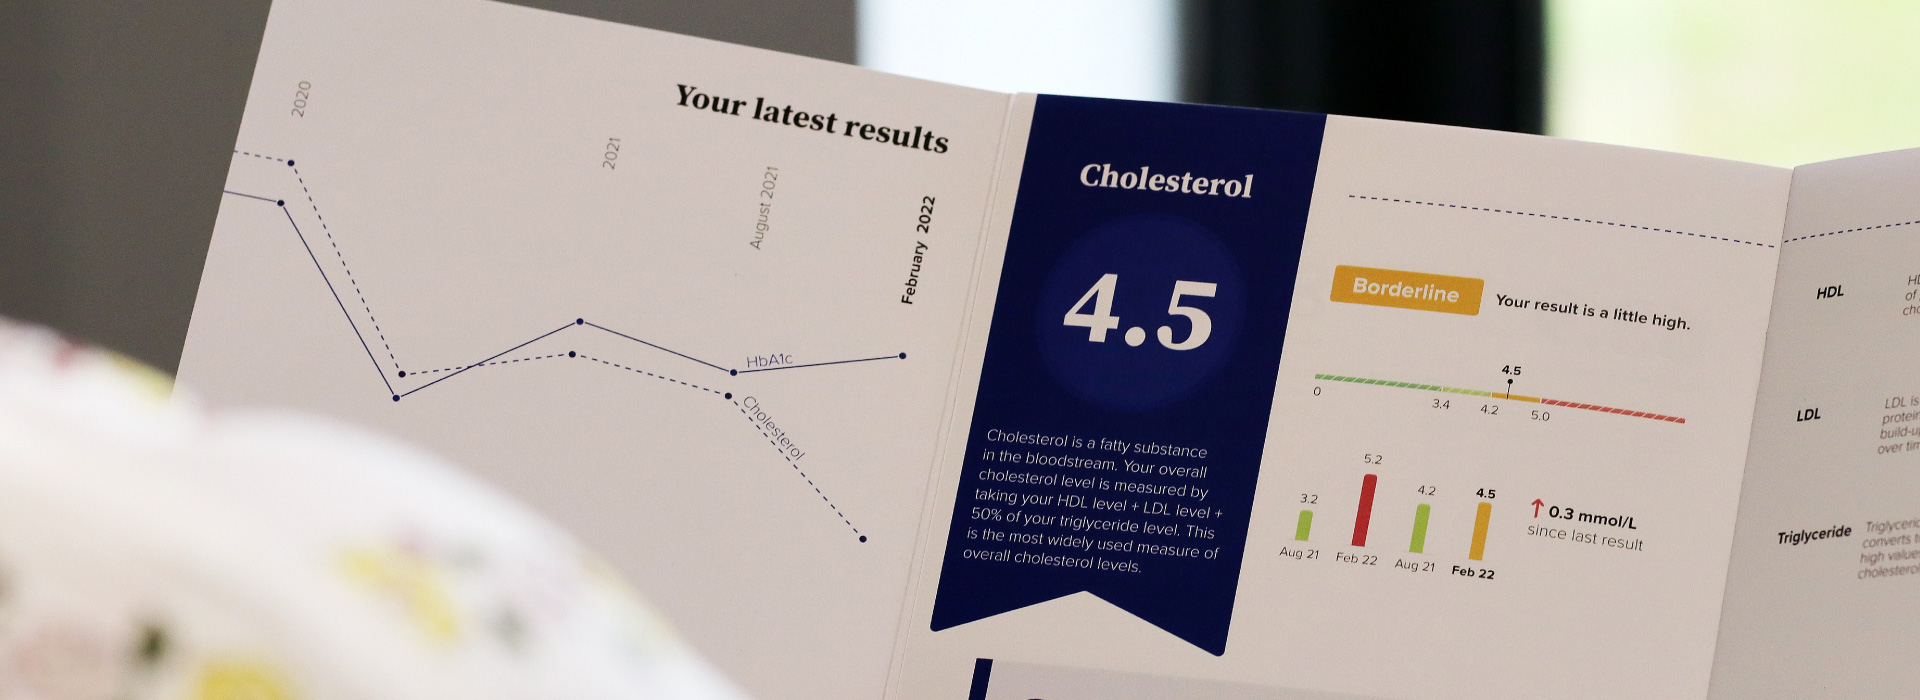
Outcome

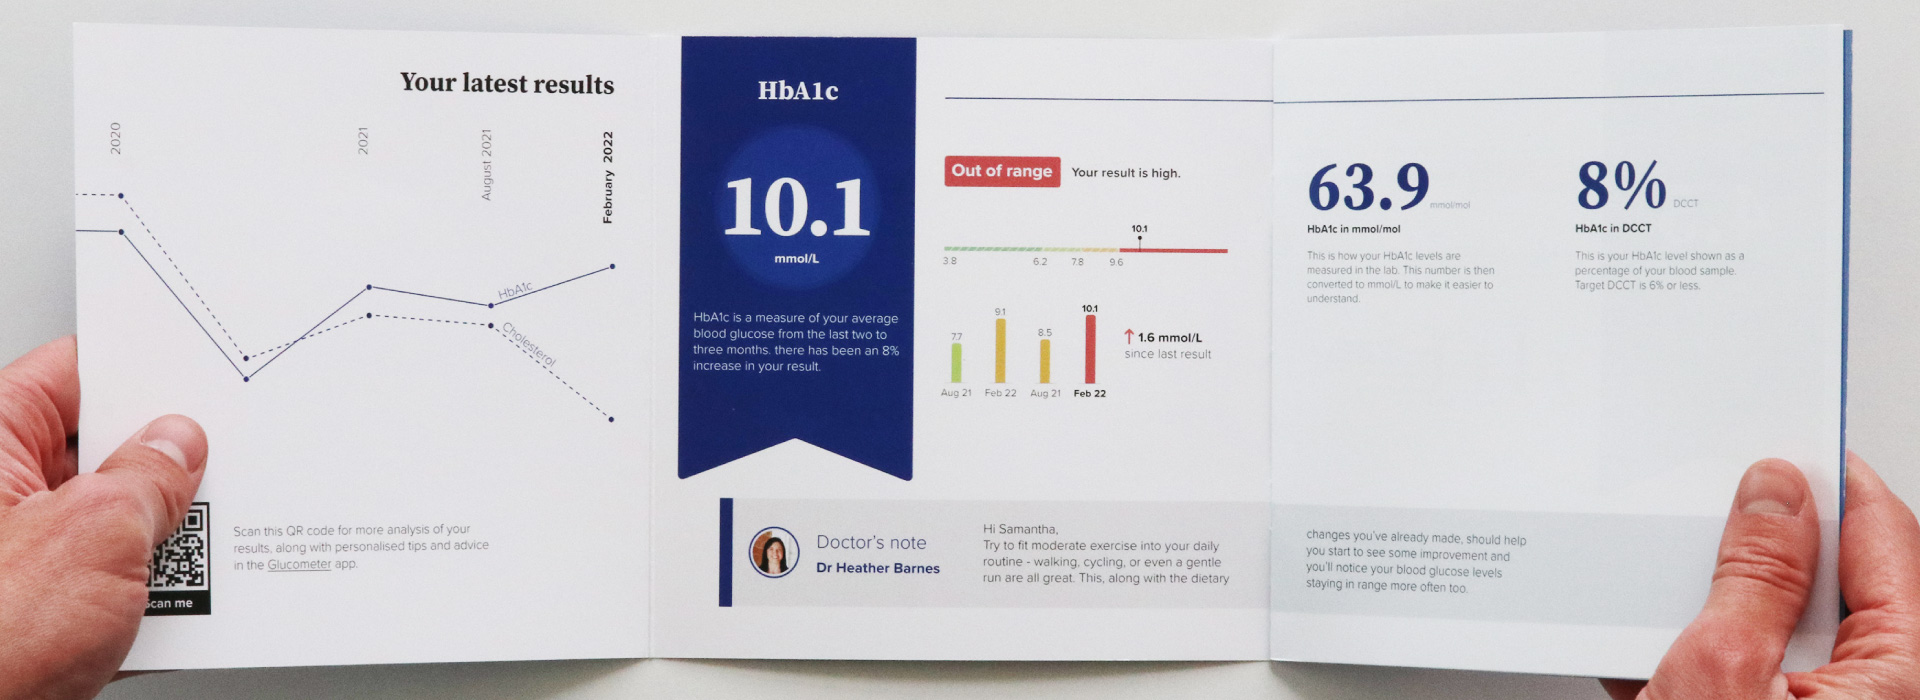
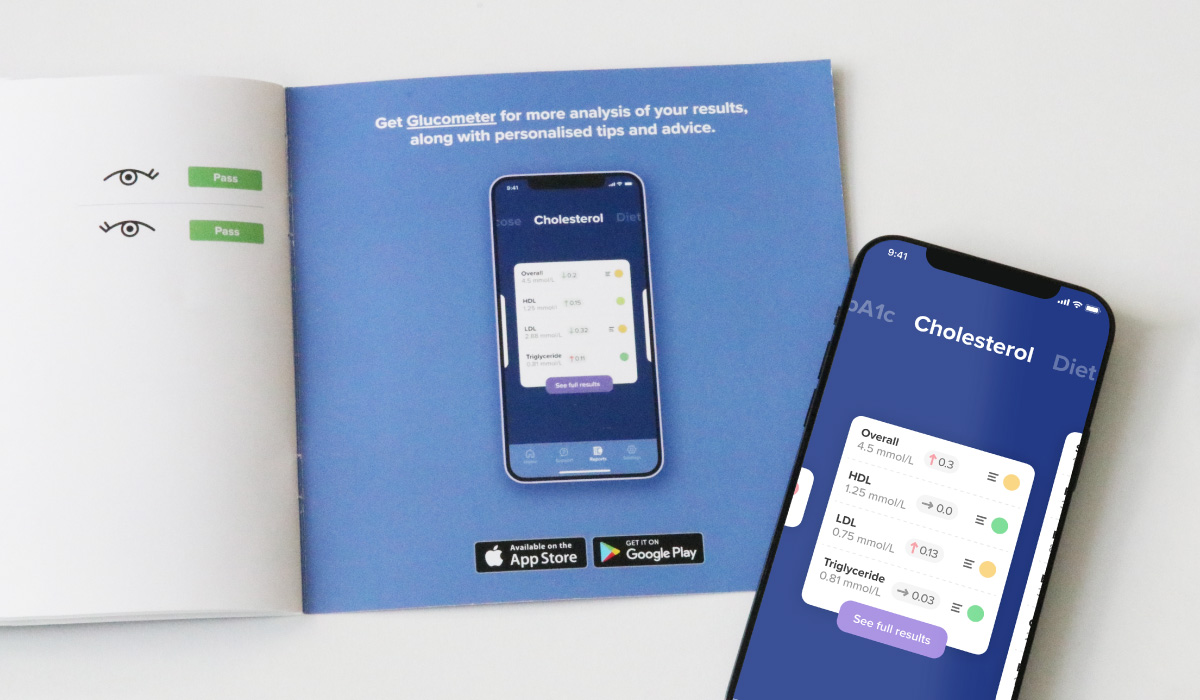
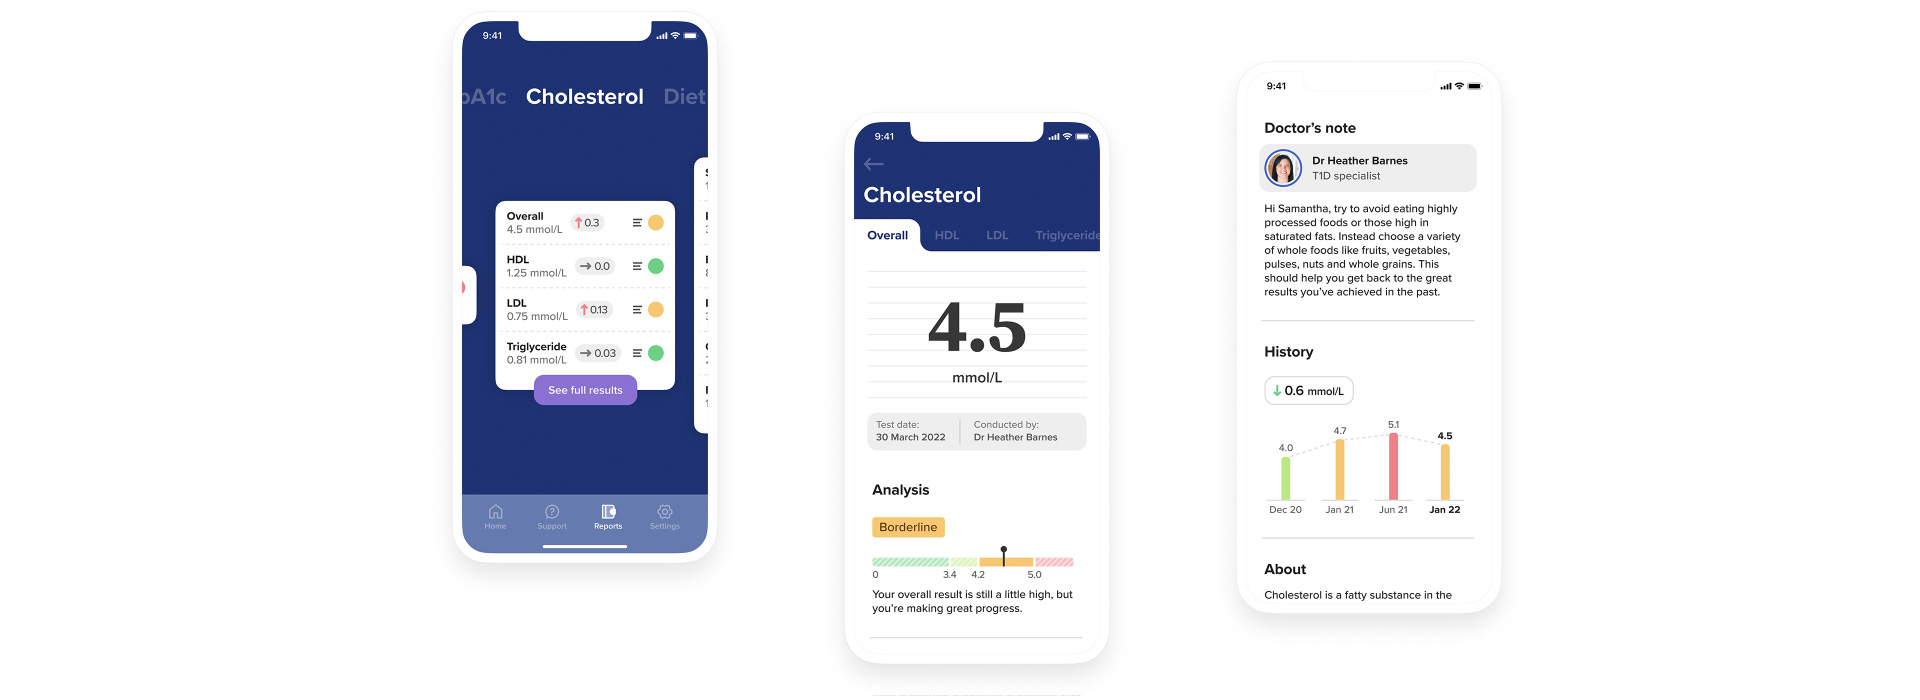
We created a printed report which displayed key parameters to help T1D patients understand how well they were managing their condition in an easy to digest format. We developed features for a companion app which complemented the report, providing an additional level of information and dynamic results history. This helped educate, prompt and motivate behavior change when needed.

An opportunity for better medical data presentation

When managing complex conditions such as type 1 diabetes (T1D), patients are exposed to a lot of data each day. Finger prick or flash blood glucose level monitors produce graphs or numeric averages. Many patients monitor how these numbers are changing each day, sometimes tracking them over weeks and months. On top of this daily management, most T1D patients receive routine blood tests every six months for factors like HbA1c, liver, kidney function, cholesterol and other measures to indicate if changes need to be made to patient behavior to maintain good health.

This data is typically presented as a ‘lab report’ which treats each measurement as a separate piece of data.

You can see an example of the reports that a T1D patient would receive below:

image-showing-patient-holding-blood-test-results

Information is hard for patients to digest and can be overwhelming for those who are trying to improve their clinical outcomes or those struggling with motivation. Current practice requires a healthcare provider or diabetes consultant to provide guidance around these lab reports.

Improving behaviour change through improved reporting

The lab report presented a clear opportunity to improve how data is presented to patients.  We decided to refine the 6 months’ printed report and correlate it with the users’ daily data solutions, typically in a digital format.

When presented well, data can provide clear guidance to patients and indicate if they are managing their condition successfully or whether a change in habit is necessary.

Refining the printed report would help to promote positive behaviors by:

  • Showing the result of their behavior (positive or negative) and providing clear guidance on how to improve an outcome
  • Serving as a ‘reward’ to reinforce positive behaviors
  • Encouraging the patient to retain the printed report and refer to it when they need guidance

The printed report: looking outside of medical for inspiration

For the printed report, we drew inspiration from the financial services sector: an annual pension statement has a similar challenge of providing actionable data to educate, motivate and encourage behavior change (in this case saving for retirement). Some pension providers have transformed the way data is presented, moving away from the ‘dry’, printed report and providing a personalized, premium printed booklet instead. These new bespoke solutions help capture the reader’s attention and display key information in a more engaging and graphical way.

Through considered use of typography, paper stock and print quality, we increased the perceived value of the printed lab report, encouraging users to retain it for future reference. When a user achieves three consecutive positive reports, they receive a gold edition as a ‘reward’ to encourage positive behavior.

We developed a fold-out format which allowed us to break up information using the folds of the pages, progressively building the story to make the key pieces of data more easily digestible for diabetes patients while also allowing the user to review the complete report in a single view.

ezgif-1-f48ef4924d-1

The report focuses on the two most readily actionable measures and treatment options for T1D patients: Hb1c and cholesterol. These two measures can be influenced by diet, medication and exercise, all of which are within a patient’s control, so it was important to promote them to encourage self-care.

Printed media offers a great opportunity to capture a moment in time which can be referred to when needed, but it does have its limitations. Printed, static media doesn’t offer the dynamic, responsive experience that a digital solution provides (zooming, scrolling, etc.). It was important to limit the amount of information in the printed report to avoid overwhelming patients and use the digital component of the system (the app) to provide more detail.

So a key requirement of the design was to signpost the digital companion app and to facilitate access via a QR code.

Enhancing experience for patients with diabetes through digital media

The digital companion app mirrors the printed report in style and content but provides patients the ability to explore further and learn more about managing their condition. In addition to the two key measures (HbA1c and cholesterol), the app provides a full set of results which the patient can access screen by screen to give a focused, encapsulated view of information.

image-of-leaflet-showing-a-phone-with-a-real-phone-next-to-it-1

Once on the individual result screen, the user can scroll down for more information and advice. For example, if potassium is low, the app provides details as to why this is an issue to help motivate a behavior and gives advice on how to address the problem, such as eating a banana.

The dynamic nature of the companion app allows several advantages over the printed report. Patients can easily compare different results by swiping through their history, allowing them to view their progress over time and see how their behavior affects their results.

The information provided for each result helps to educate the patient and indicate why certain behaviors, such as diet or exercise, are important. Life as a type 1 diabetic can be complicated, so the hints and tips feature of the companion app is a useful reminder of how patients might improve their results through a change in behavior.

A system approach to improving data visualisation

Both digital and printed information assets were designed as part of a single harmonized system, each focusing on the unique benefits of printed and digital media. The printed report is a high-quality, ‘premium feel’ solution which the patient is encouraged to keep, providing both a summary that is easy to refer to and a tangible reward for successful self-management. The digital component provides dynamic information when needed and adds an additional level of data in addition to educational and motivational material.

If healthcare is to be taken to the next level, we believe that when designing all patient access points, we should be considering user experience of data solutions, exactly as we would do for a consumer product.

Chris Baldock, UX Design Specialist, Team Consulting

Wonder how we could help?

Let’s start working together on your next challenge.